Main components of the GROMS information system
The GROMS database was designed to summarise the disparate knowledge about migratory species within one information system. Given the severe constraints upon time and human resources, a decision was taken to use standard software and synergies arising from cooperation with other database projects. Communication with potential contributors and future users was initiated at an early stage by means of the GROMS website and an email discussion list.
The aim was for the database to be accessible as:
The database and the GIS data can be accessed separately by using the respective software. A Java-based information desk unifies both data sets within a Graphical User Interface (GUI) for visualisation of interactive maps on the World Wide Web. The interface allows searching for species occurring within a certain area, queries by simple drop-down menus and generation of species reports. On the CD, a Java-based map viewer allows to view geo-data without any additional GIS software. This tool includes a "Movie Mapper" for an animated display of migration routes, providing a much better
picture of the complex spatio-temporal aspects on migration (DV Movie Mapper, Dialogis).
Both versions should be easy to use for a broad variety of users, but in particular for conservationists, scientists and decision makers. Taking into account these constraints, the following software components were selected (Figure 3.1.).
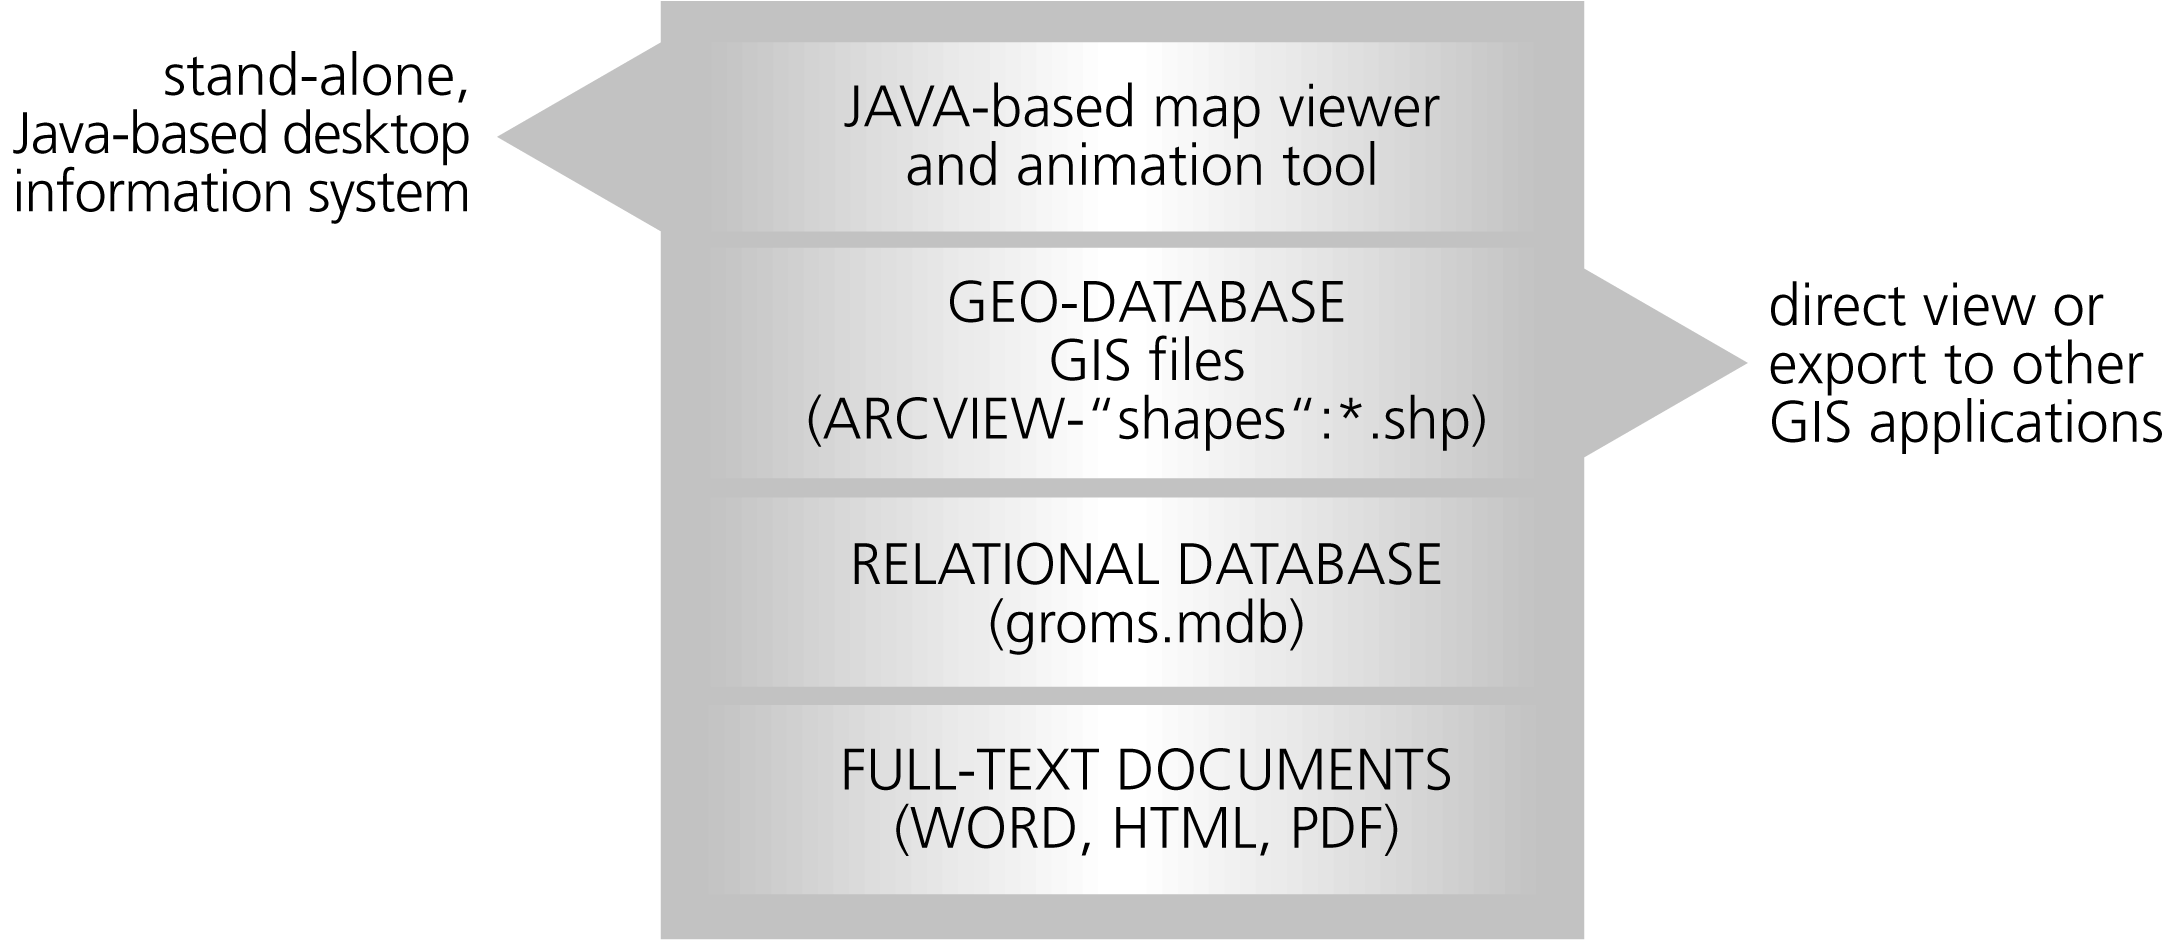
| Fig. 3.1: Main components of the GROMS information system and content of the CD. The database and GIS maps were generated by standard software, and files can be accessed directly by the user with the respective software. Java-based tools provide access to GIS data without additional GIS-software. Technical details and an installation guide are accessible by clicking on "groms.html" on the GROMS-CD. The Internet version is accessible via http://www.groms.de. |
Abb. 3.1: Wesentliche Komponenten des GROMS-Informationssystems und Inhalt der CD. Zur Erstellung von Datenbank und GIS-Karten wurde weit verbreitete Standardsoftware verwendet, mit der der Nutzer direkt auf die Inhalte zugreifen kann. Darüber hinaus erlauben plattformunabhängige Java-Programme eine Darstellung von Karten ohne zusätzliche GIS-Software. Technische Detailinformationen und Installationsanleitung sind über das Dokument "groms.html" auf der GROMS-CD abrufbar. Eine Web-Version des Java-Auskunftsplatzes ist über http://www.groms.de zugänglich. |
Integration of geodata
Maps are among the most important tools to represent the complex geographical distribution of migratory species, which varies with time. Migratory species occupy distant geographical areas during feeding or breeding, using specific migratory routes and ‘stepping stones’ for resting and feeding. Certain areas are often visited for a short time (only days), but might harbour great concentrations or even the total of a population. Geographical Information Systems (GIS) are ideal tools for storing such complex geodata. A GIS consists of a data bank and a system permitting the processing and analysis of spatial (geographical) data (Longley et al. 1999). Spatial data can be stored either as vector or as raster data (Figure 3.2), depending on the purpose of the analysis, but formats can be converted (cf. Couclelis 1992). Vector data need little storage space and consist of basic geometrical objects, such as polygons, lines or points. These objects have attributes stored in the database, such as the bibliographic reference for the map or a time code representing the months when an animal can be found within the respective area. In contrast, raster data subdivide the world into a regular grid, where each cell is connected to attribute data within the database. This concept is equivalent to the datasets resulting from raster counts and maps, as f.e. published in the EBCC Atlas of European Breeding Birds (Hagemeijer & Blair 1997). Studies on vegetation cover by remote sensing are another example of raster GIS application in biology. Though interchangeable, the different formats are normally handled with different GIS software. IDRISI is one of the better-known GIS systems for raster data, while ArcInfo or ArcView are used to handle vector data. Most maps entered into GROMS are based on simple geometry, and therefore were represented as points, lines or polygons within a vector GIS.Once distribution maps or point data have been digitised, they can be visualised easily in different scales or projections. If data have a time-code (e.g. satellite data), they can be animated on-screen. Other map layers can be added, such as cities, rivers or contour lines, or distribution maps of other species. Raster images can be used as a background, such as satellite pictures used for some of the maps in the map section (Annex 2). Besides the low storage space, species distribution maps in vector format allow a number of interesting applications, such as:
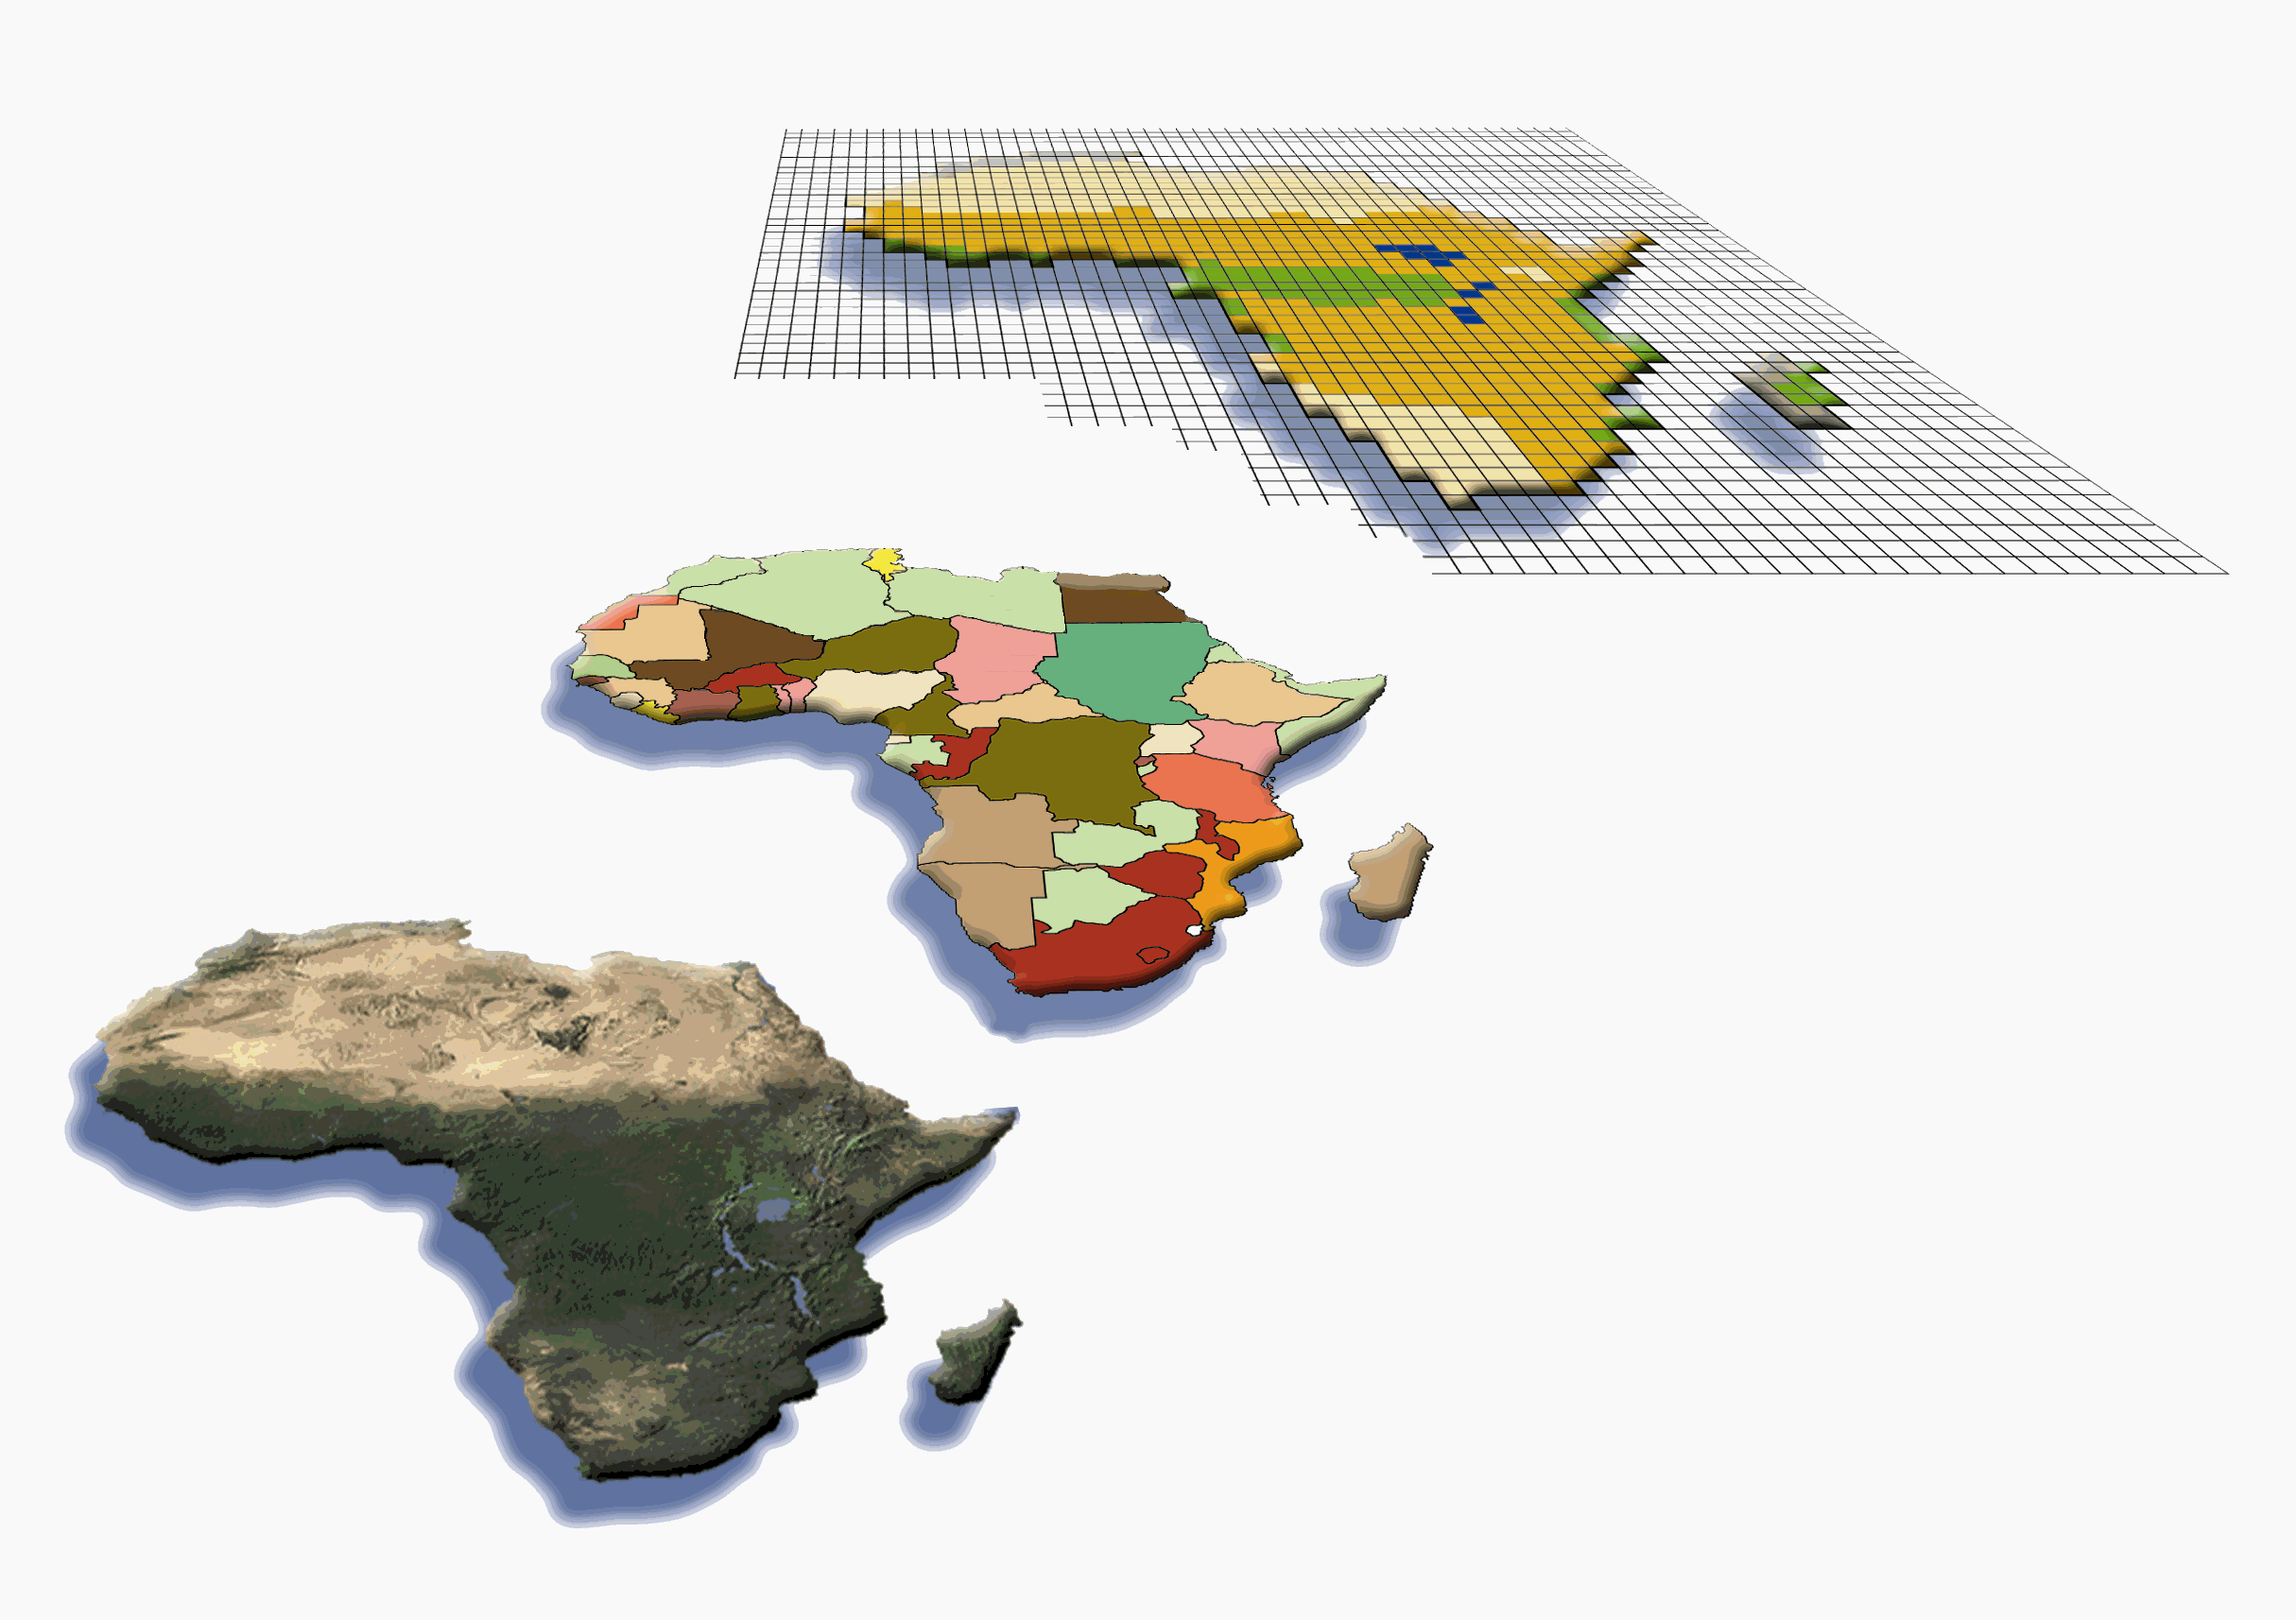
| Fig. 3.2: Examples of GIS datasets. below: Satellite picture, middle: vector file of political boundaries, above: Raster GIS data of major ecological areas. Note that GIS vector files require minimal storage space (10 kB), while the map pictures need several megabytes. | Abb. 3.2: Beispiele für GIS Datensätze. Unten: Satellitenbild, Mitte: Vektordaten politischer Grenzen, Oben: Raster GIS Daten wesentlicher ökologischer Zonen. GIS Vektordaten benötigen minimalen Speicherplatz (~10 kB), während Bilder von Karten mehrere Megabytes benötigen. |
The relational database
A relational database consists of separate tables which are connected by different types of relations (Simovici & Tenney 1995, Harrington 1998). Storing related information within different tables avoids redundancy and spelling errors, and allows much more efficient data entry. The underlying structure of a database – the data model – is invisible to the user, who accesses the databases by pre-programmed graphical user interfaces. Experienced users can query the different tables by a Standard Query Language (SQL), which is similar for any relational database. This allows data exchange between different databases. Understanding the underlying data model allows extended possibilities for data analysis by SQL. This section describes the major modules of the database, as shown in the block diagram (Figure 3.3). Each module could be considered a relational database in its own right. The modular design allows easy extension with additional information layers in the future.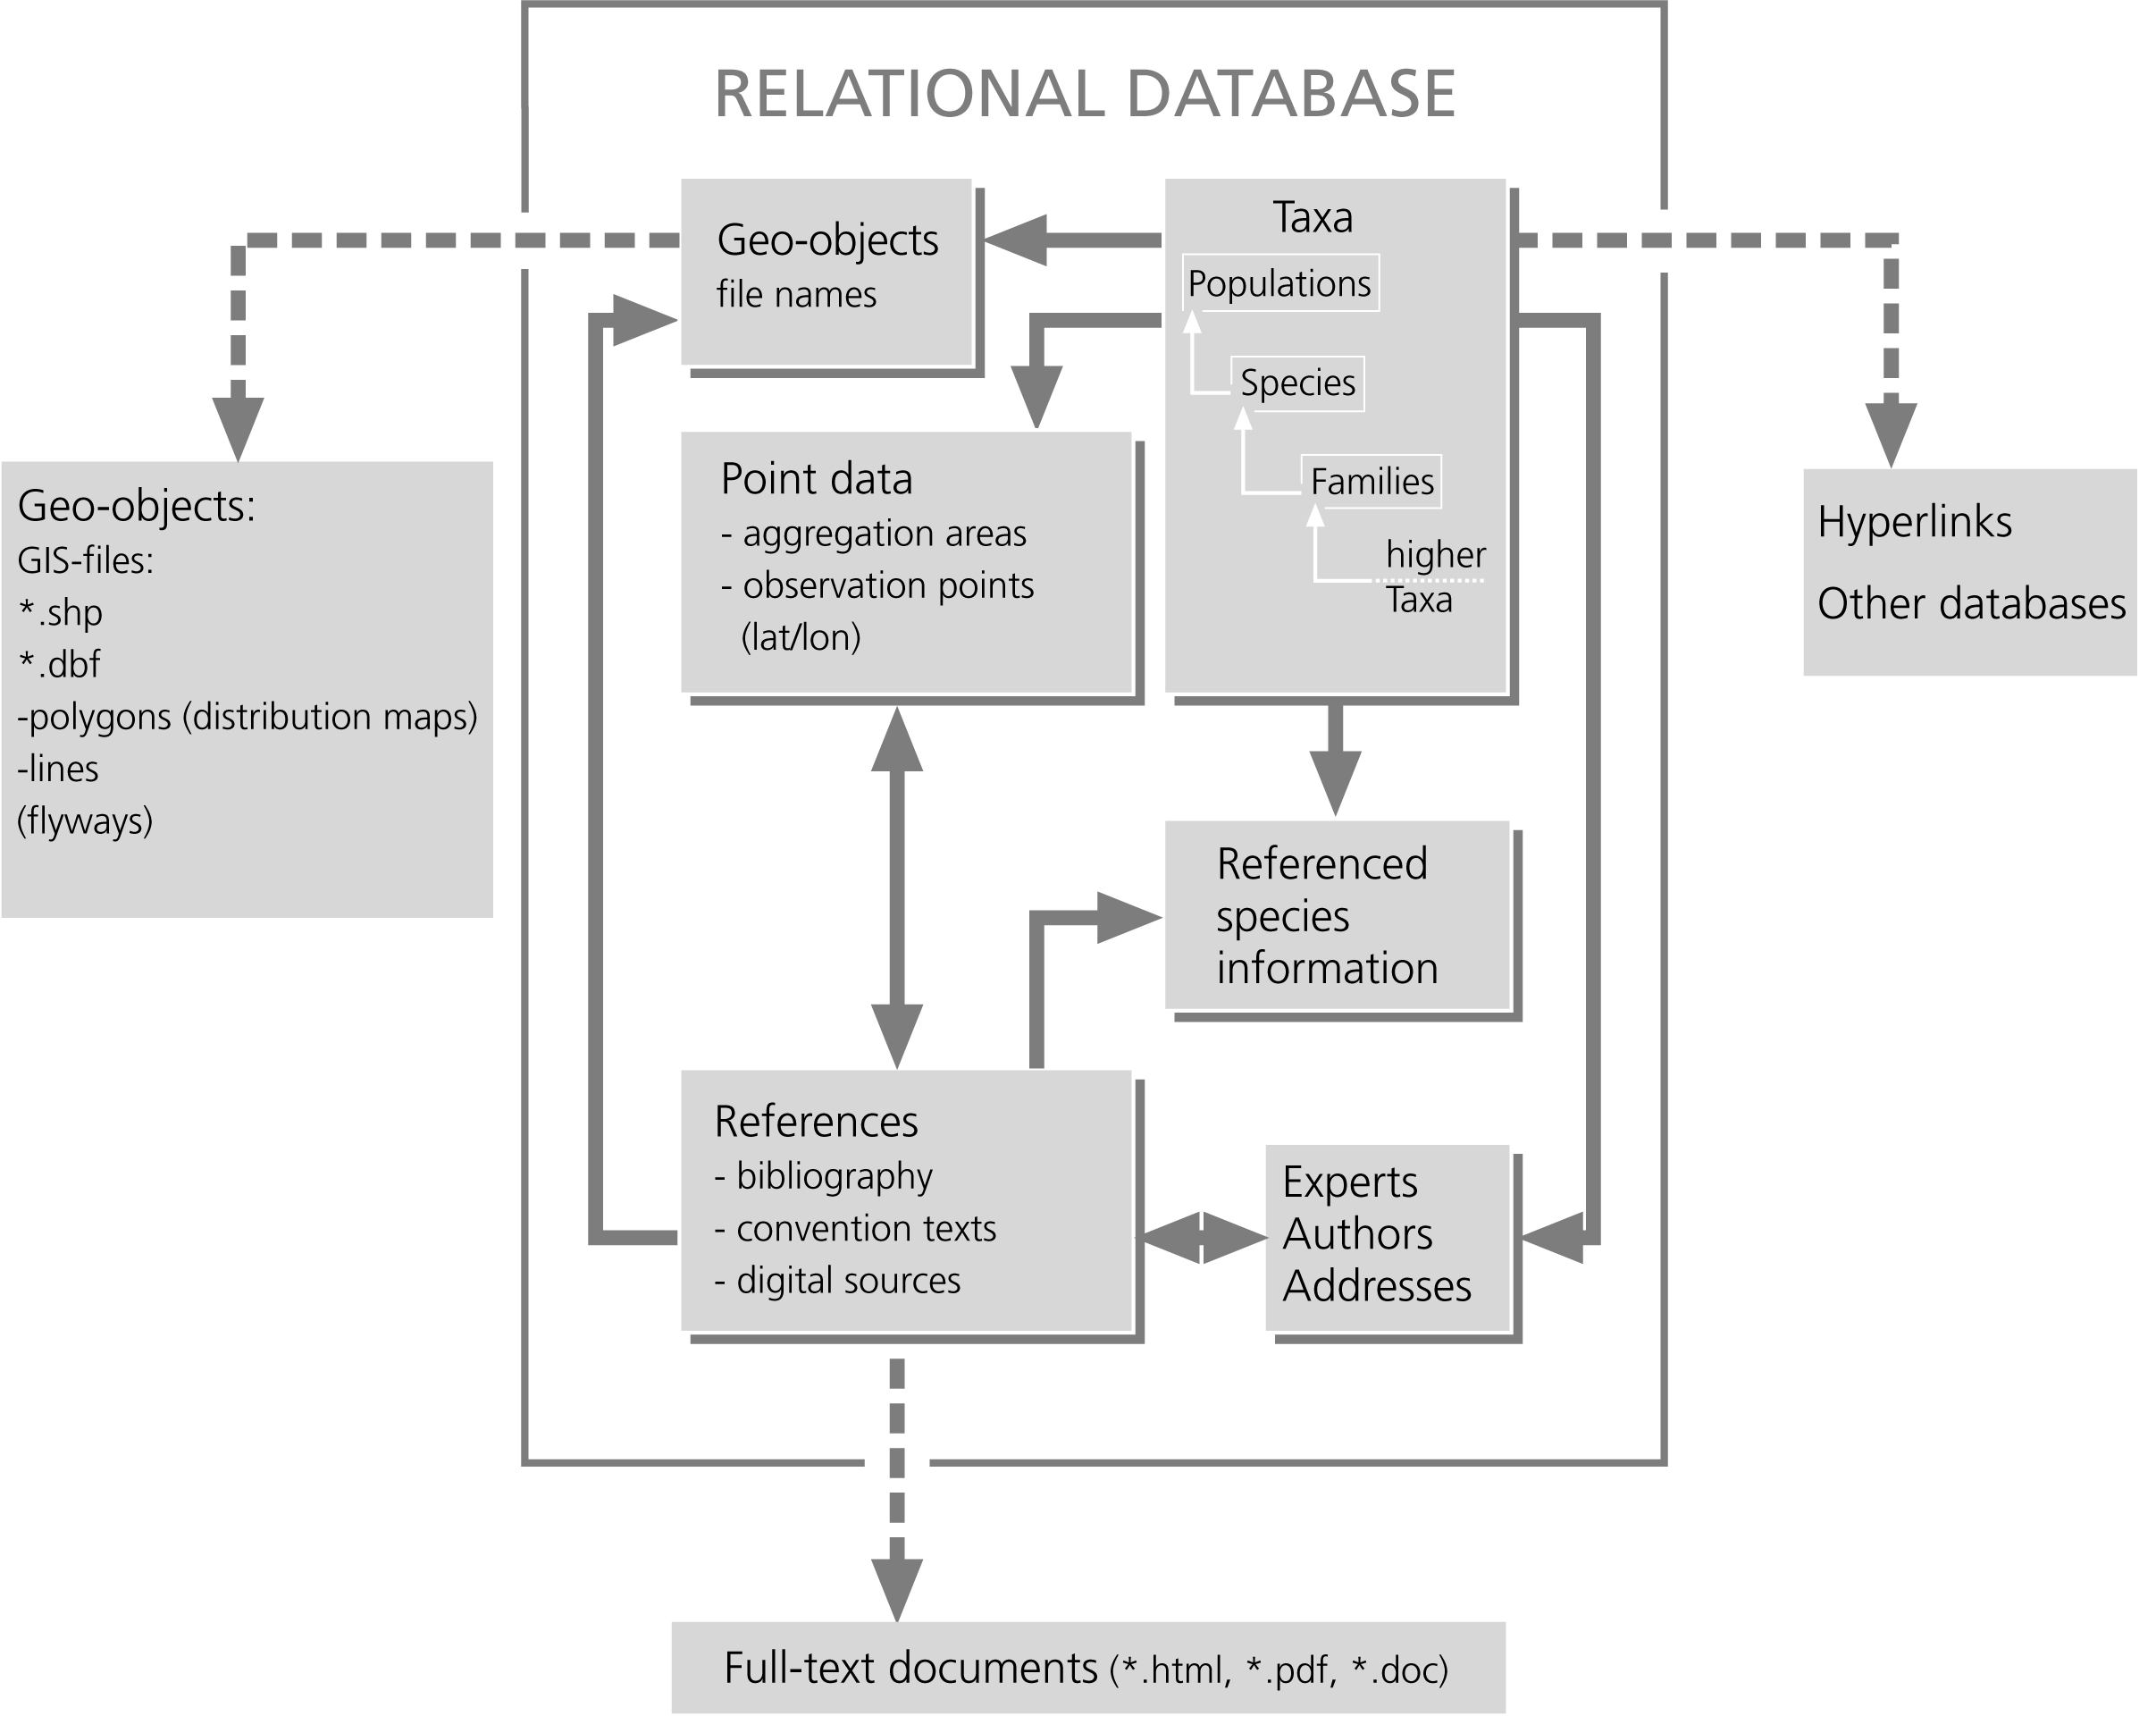
| Fig. 3.3: Block diagram of the GROMS data model. Each module can be considered as an independent database. All data are fully referenced. Therefore, the reference section is a central part of the database. Geo-objects such as lines and polygons have to be stored outside the database, but their file names are administered by the geo-object module. | Abb. 3.3: Blockdiagramm des GROMS Datenmodells. Jedes Modul kann als eigenständige Datenbank betrachtet werden. Alle Dateneinträge enthalten die Quellenangabe. Daher ist das Literaturmodul ein zentraler Bestandteil der Datenbank. Die Geoobjekttypen "Linien" und "Polygone" werden außerhalb der Datenbank gespeichert, aber die Dateinamen werden von der Datenbank verwaltet. |
In accordance with the different thematic areas, the database contains the following thematic modules:
Connecting geo-information with the database
The complex format of GIS data requires that map files ("geodata") are stored outside the database, while metadata on maps and filenames are administered within the GROMS database (see Figure 3.3). The innovative aspect of GROMS is its efficient integration of the different modules, and in particular of geodata.Transformation of printed maps into GIS format requires
The rather technical details of these processes are described in more detail in Annex I, while the following section gives an outline of basic principles and caveats for the novice.
Most maps describe the general distribution ("Expected Area") of a species’ range, which might differ from the actual distribution ("Area of occupancy"), which is based on well-documented point data or well-defined distribution models (Figure A2.13; for a detailed discussion, see Institute of Applied Ecology 1998). In addition, most maps are on a global scale, and users should bear in mind that accuracy is in the range of ± 100 km. Additional, minor errors occur by transformation into the GIS-format. Maps have been adopted from the source without modification. Therefore, the bibliographic reference is an integral part of the map. For some species, GROMS contains maps from different sources, at various resolutions, and they reveal considerable differences when superimposed (see Figure A2.17: Monachus monachus, Figure A2.49: Vanellus gregarius, and chapter 4.3).
Additional point data have been gathered from "observation points", which are simply defined by their geographic place name and co-ordinates (latitude and longitude).
Such places can be aggregation sites for breeding, staging or moulting, monitoring sites such as bird observatories, or even catastrophic events such as oil spills or red tides. By linking observation points with the species table, GROMS encompasses all these possibilities within one common underlying data model. Point co-ordinates are stored directly within the database, but can easily be integrated into the respective GIS maps (see Figures A2.28 ff.). As a test for database structure, functionality and retrieval tools, 850 important staging areas for Eurasian ducks have been entered from Scott & Rose (1996). This data set allowed calculation and mapping of species diversity for each site (Figure A2.39).
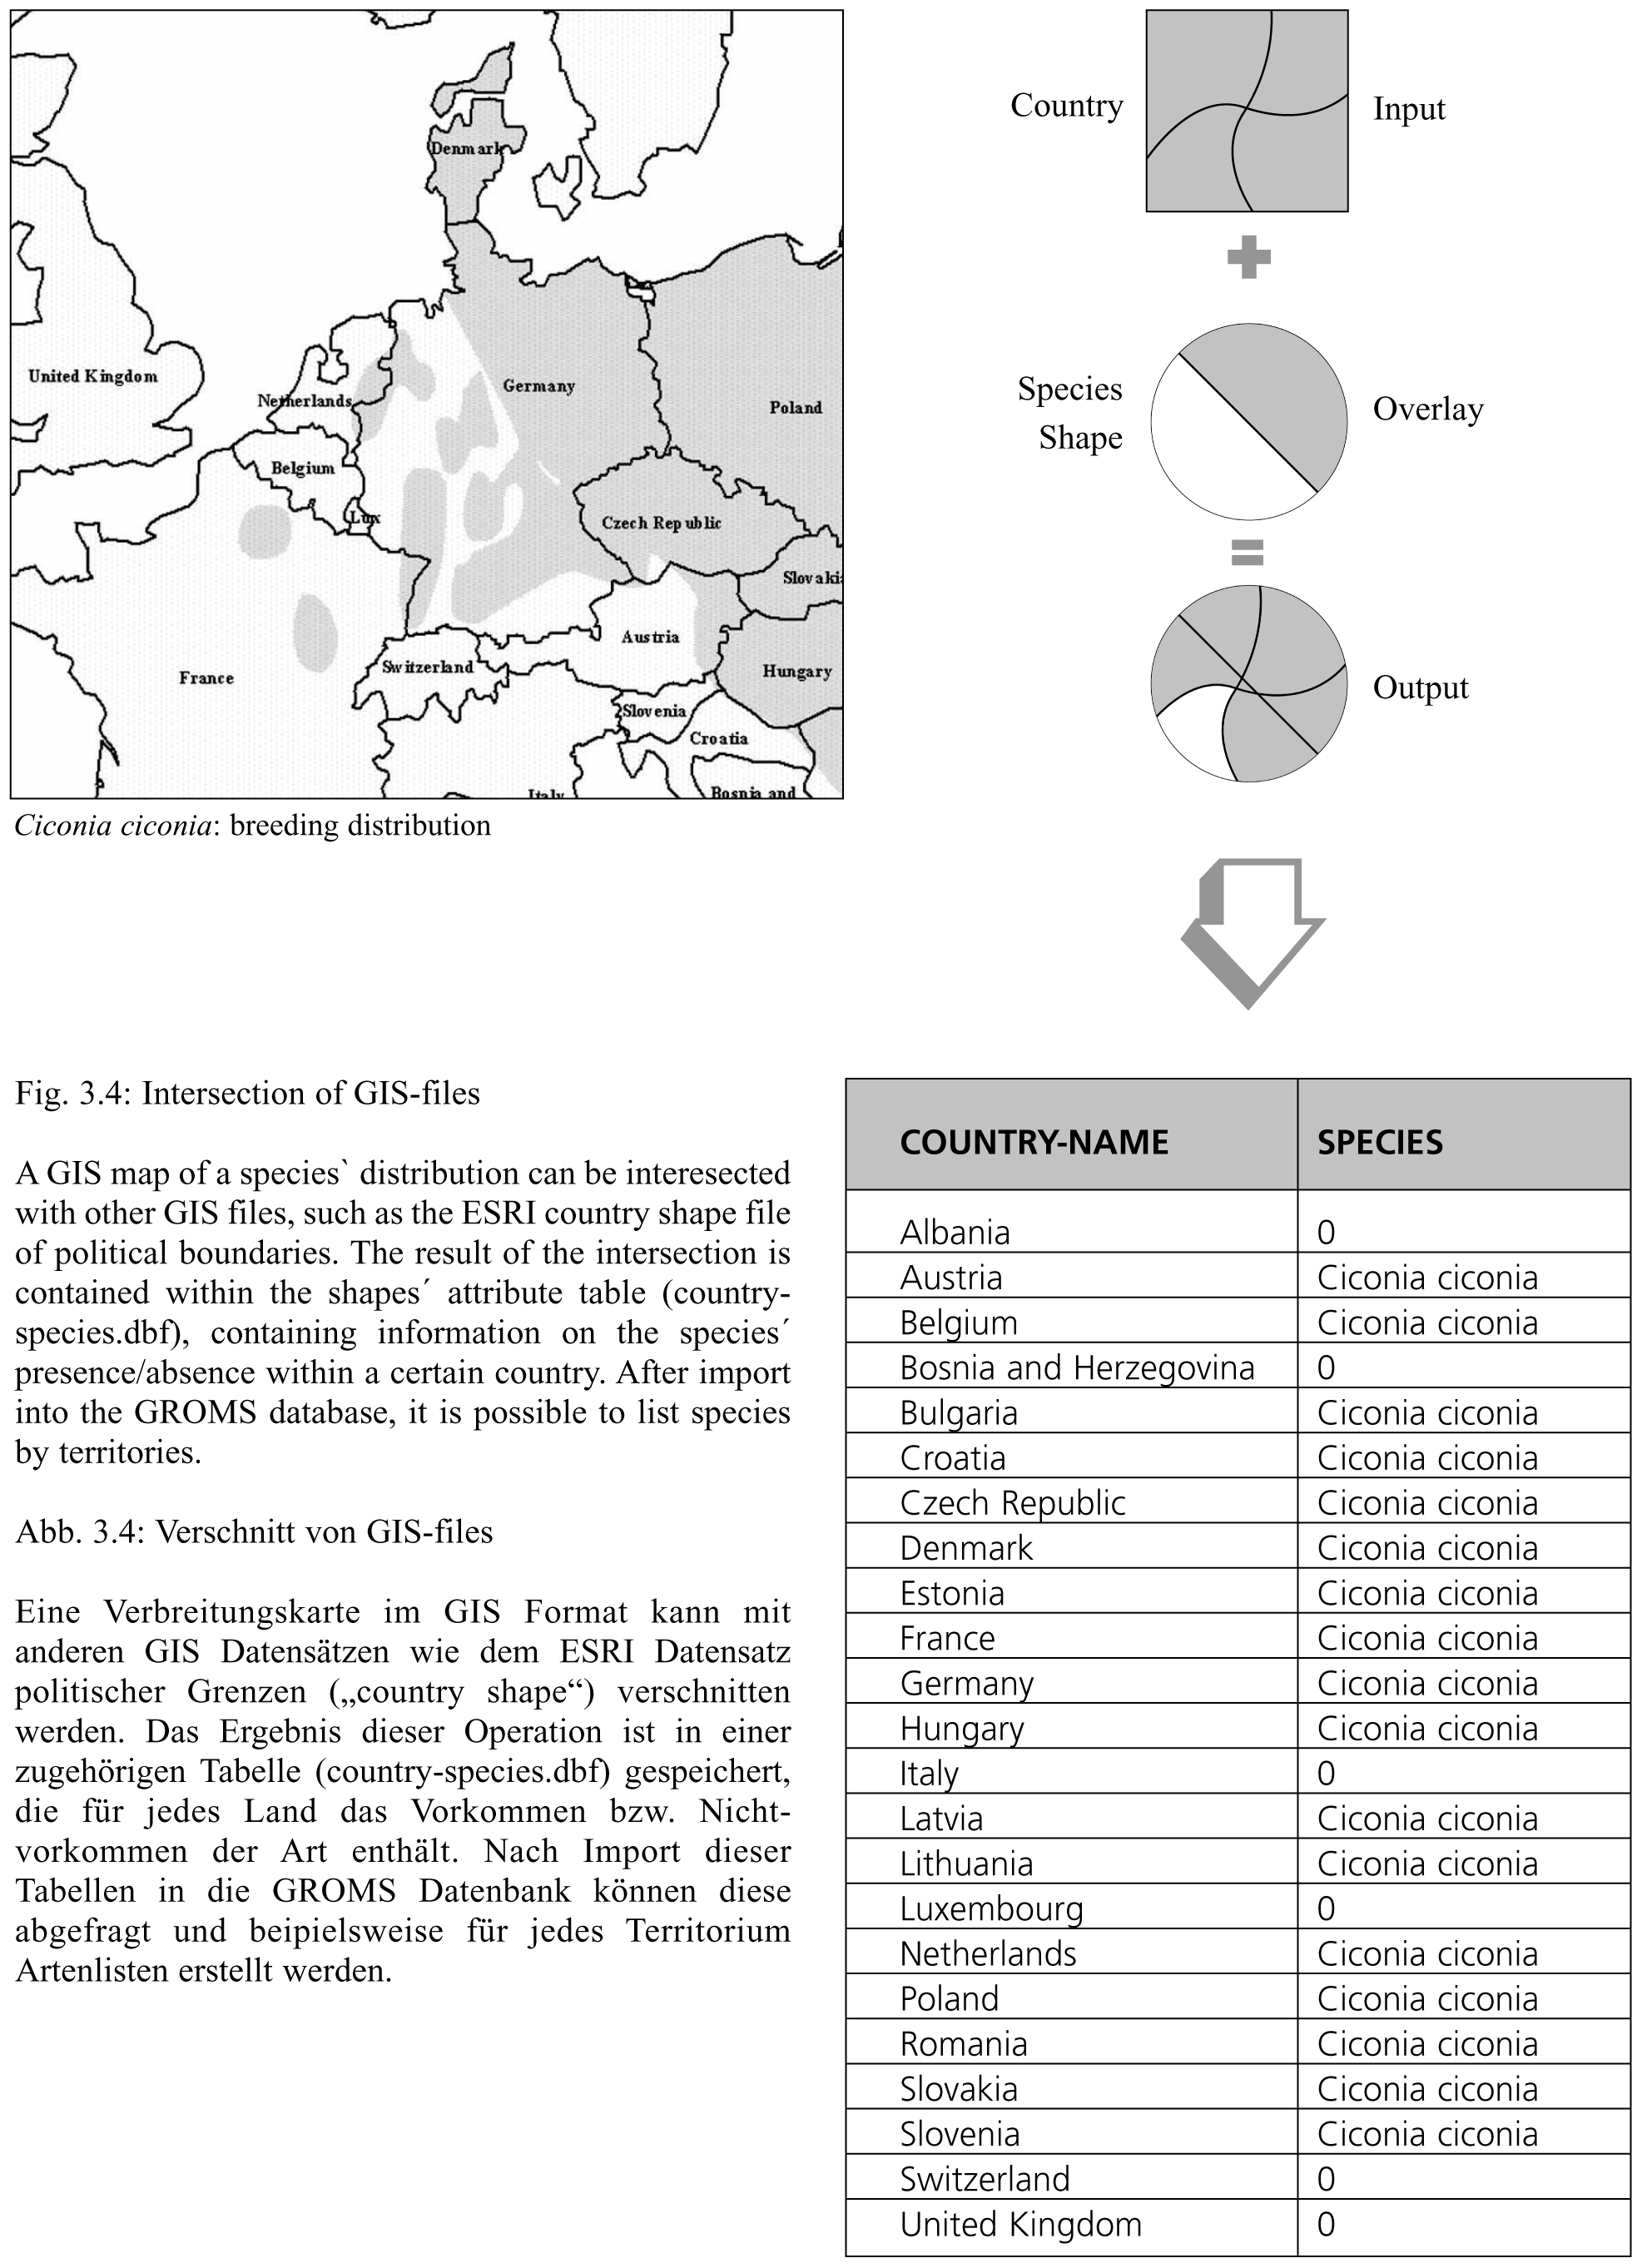
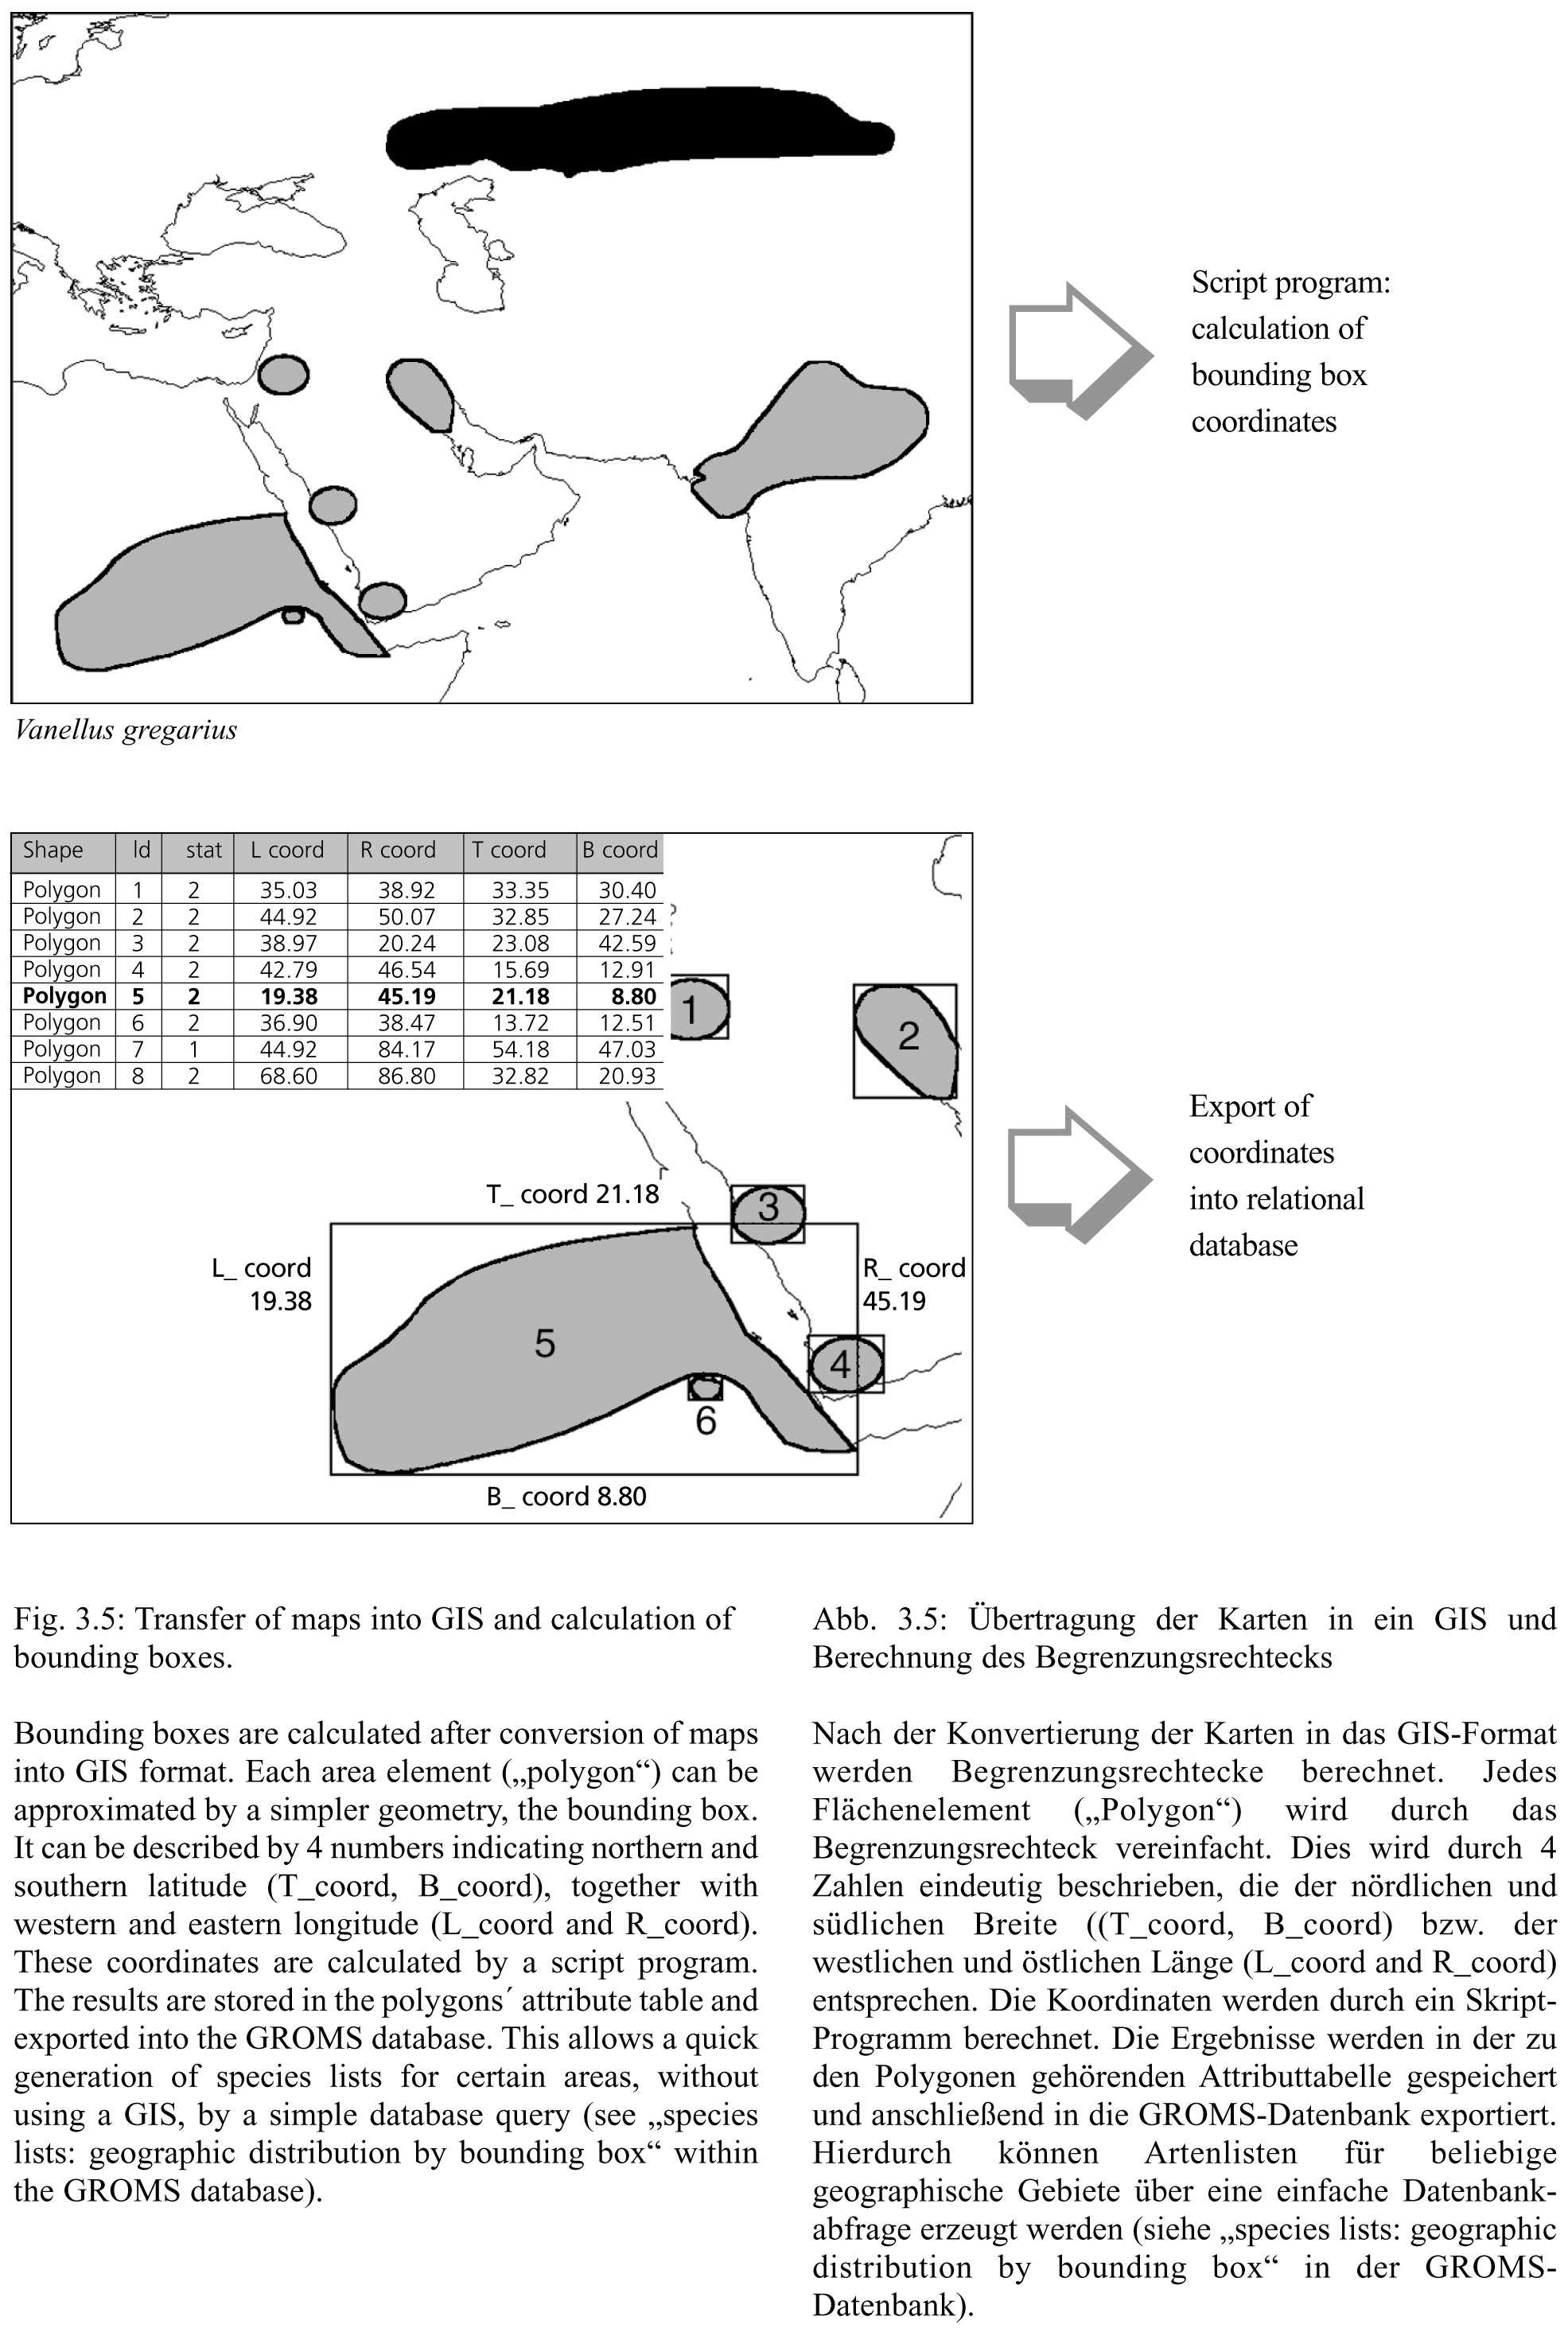
Most GIS analysis has to be performed with GIS software, i.e. outside the database. However, even the simple question for species occurring within a certain area requires the execution of a number of complex GIS operations. Therefore, some results of general interest have been integrated into the database. The two examples illustrated in Figures 3.4 and 3.5 generate information on the range states and provinces, where a species is reported, and the bounding boxes for each distribution area (Figure 3.5). The results have been stored in the relational database, and therefore allow a much more efficient retrieval of geodata, without using the GIS.
Figure 3.4 illustrates an example of integrating geo-data resulting from GIS operations into the database: species distribution maps were intersected with geopolitical units, and the resulting lists of territories is then integrated into the database. A second example is illustrated in Figure 3.5, showing the calculation of bounding boxes for each distribution area of a species. The bounding box co-ordinates were imported into the database, and the species occurring in a given area can be found through a simple database query. Please see "geographic selection by bounding box", within the "Species lists" form of the GROMS-CD (see Annex I: User guide). However, the reader should be aware that the bounding box is an approximation, and that lists are calculated only from the available GIS maps. Therefore, species without maps are not yet covered by the geographic selection.
Filing system
Besides geo-data, there re a variety of other data which are stored outside the database, such as full-text documents, pictures and additional software tools. All folders are all organised according to major taxonomic groups. For standard applications, files are opened by launching a web browser or the respective software directly from the user interface. However, more advanced users might want to export files to other applications, or view them directly without opening the database. GIS files in particular can be intersected with other GIS data, e.g. on land use or vegetation.Taxonomic authority files and links to other databases
Taxonomic authority files form the backbone for any biodiversity informatics project, providing up-to-date species lists and possible links to other databases. The species authority files used by the GROMS are listed in Table 2.1. FishBase (Froese & Pauly 2001) is the only digital list including subspecies and populations ("stocks"). For all other groups, most of the species names and all subspecies names were entered manually, but partial lists were contributed in electronic format (see acknowledgements and data contributors). Considerable inconsistencies were diagnosed between bird names used by major reference works or handbooks, such as Sibley & Monroe (1991) or del Hoyo et al. (1992-2001). Species names from the latter are stored as "important synonyms", because it was used as a source for maps and subspecies names. Therefore, names are nor a reliable link to other databases, and species index numbers (IDs) from major databases are stored within separate fields of the species table. Experienced users can use these fields for a direct connection to other databases, such as the International Red List (Hilton-Taylor 2000) or Fishbase (Froese & Pauly 2001). Species index numbers are hopefully more resistant against taxonomic changes, and allow easier update of information between the different databases. An additional, more user-friendly link is provided by hyperlinks, which appear within the species report. Clicking on this "hotlink" launches a web-browser and recalls a more comprehensive species report from another website or database on the Internet.Similar problems were encountered with higher taxonomy (families and orders). An adequate coverage of existing systems would require parallel management of taxonomy. This will be the task of the previously mentioned taxonomy initiatives (see chapter 2), and exceeds the scope of GROMS and probably any other thematic database. Therefore, GROMS uses well-established groups names such as "waterbirds" or "raptors", in addition to systematic hierarchies. These categories are more familiar for the non-specialist, and are frequently used by conservationists.
Bibliography
The main purpose of the literature module is to track the exact reference to information stored in the database. Only evaluated references have been linked to individual species, but many more citations have been entered. However, GROMS cannot substitute professional bibliography services, such as BIOSIS or Zoological Record, which should be consulted for a comprehensive search. Nevertheless, the literature module contains a considerable number of important publications, including references to entire bibliographies and grey literature, including unpublished reports such as the CMS proposals for certain species. Several citations are linked to full-text documents. Users searching for certain species should be aware that neither the GROMS database nor the mentioned services cover all synonyms for a species. Besides the scientific name, users should search by vernacular names of species and families, as well as by important synonyms. For example, a search for the great egret Casmerodius albus in BIOSIS comes up with 14 references, the synonym Egretta alba yields only 7 (different!) references. In addition, one should not forget to search for the vernacular name ‘great egret’ itself.Additional references can be found free of charge within the databases of large natural history libraries.
• Results
This document is part of the publication "Riede, K. (2001): The Global Register of Migratory Species Database, GIS Maps and Threat Analysis. Münster (Landwirtschaftsverlag), 400 pp."
+ CD (see copyright), orders: